Regional Transparency in Ranked Choice Voting
Another criticism frequently raised against Ranked Choice Voting is that some counting methods make regional reporting impractical, require centralized tabulation, and reduce transparency into how voters voted within each region.
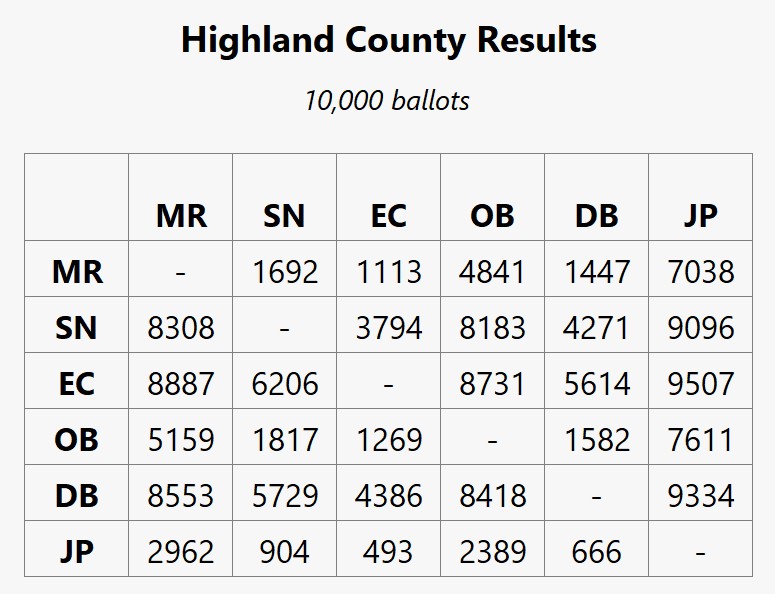
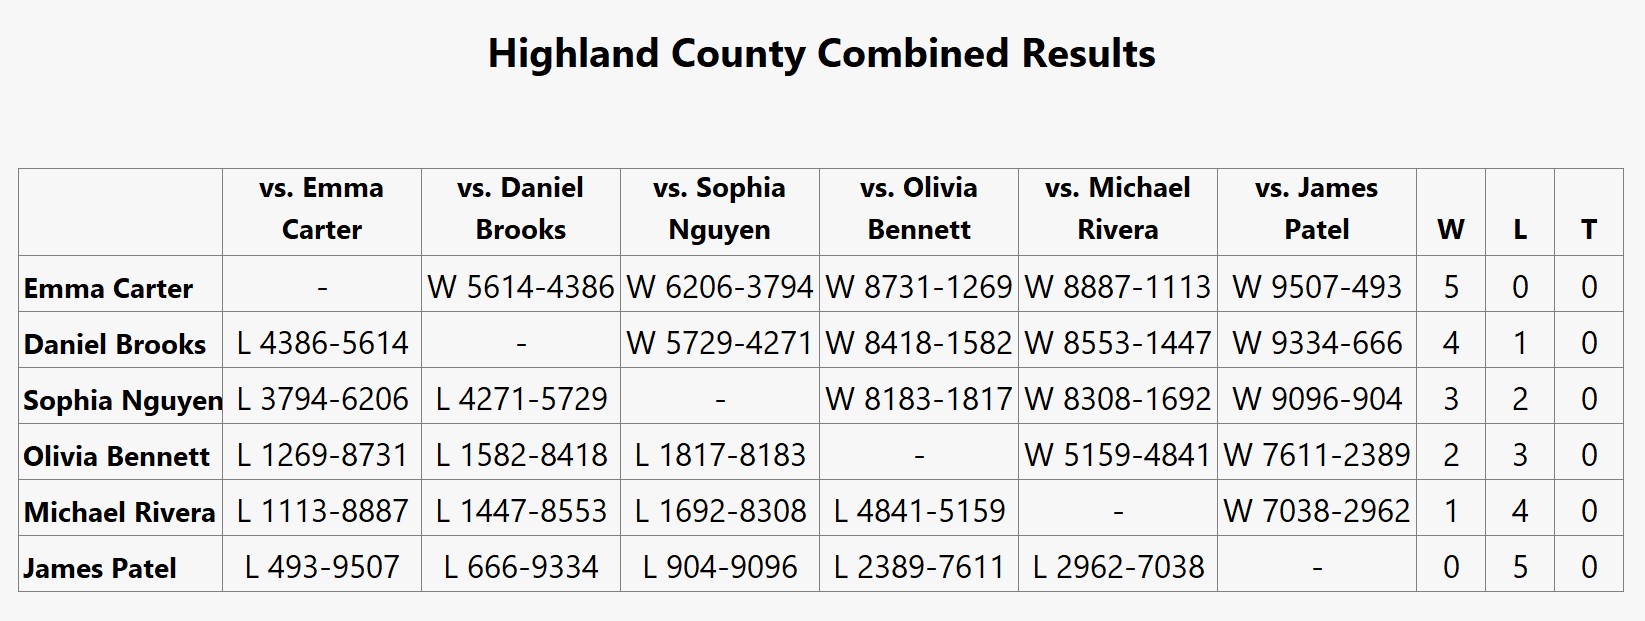
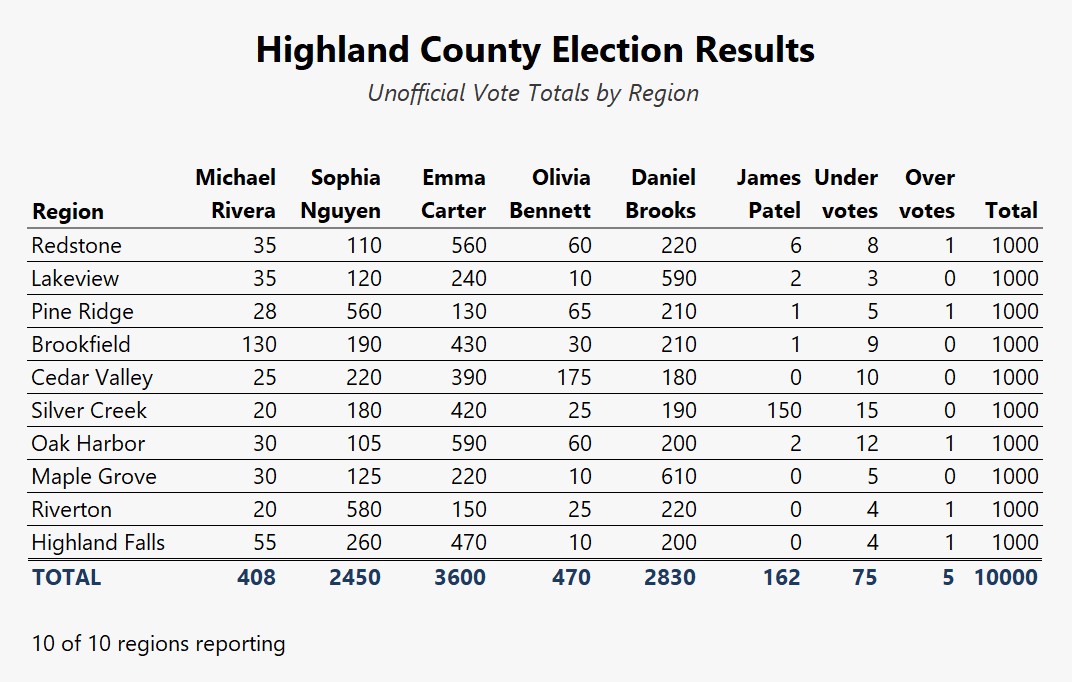 Traditional single-choice elections are almost always reported regionally. For example, this fictional Highland County table shows a typical style of regional reporting. Each local region reports votes received by each candidate. Those subtotals can then be combined into a countywide total in a completely transparent fashion, so in addition to the vote totals, observers can still see how each region voted.
In single-choice voting, local regions only need to report:
- Total votes for each candidate
- Total undervotes, which are ballots where no candidate is selected
- Total overvotes, which are ballots where more than one candidate is selected
If we let RSCV represent the number of required reporting totals for single-choice voting with N candidates, it can be calculated as:
For example, in the Highland County example with 6 candidates:
Even as the number of candidates grows, regions can still summarize local results with a relatively small number of reported totals.
Instant Runoff Voting Reporting Requirements
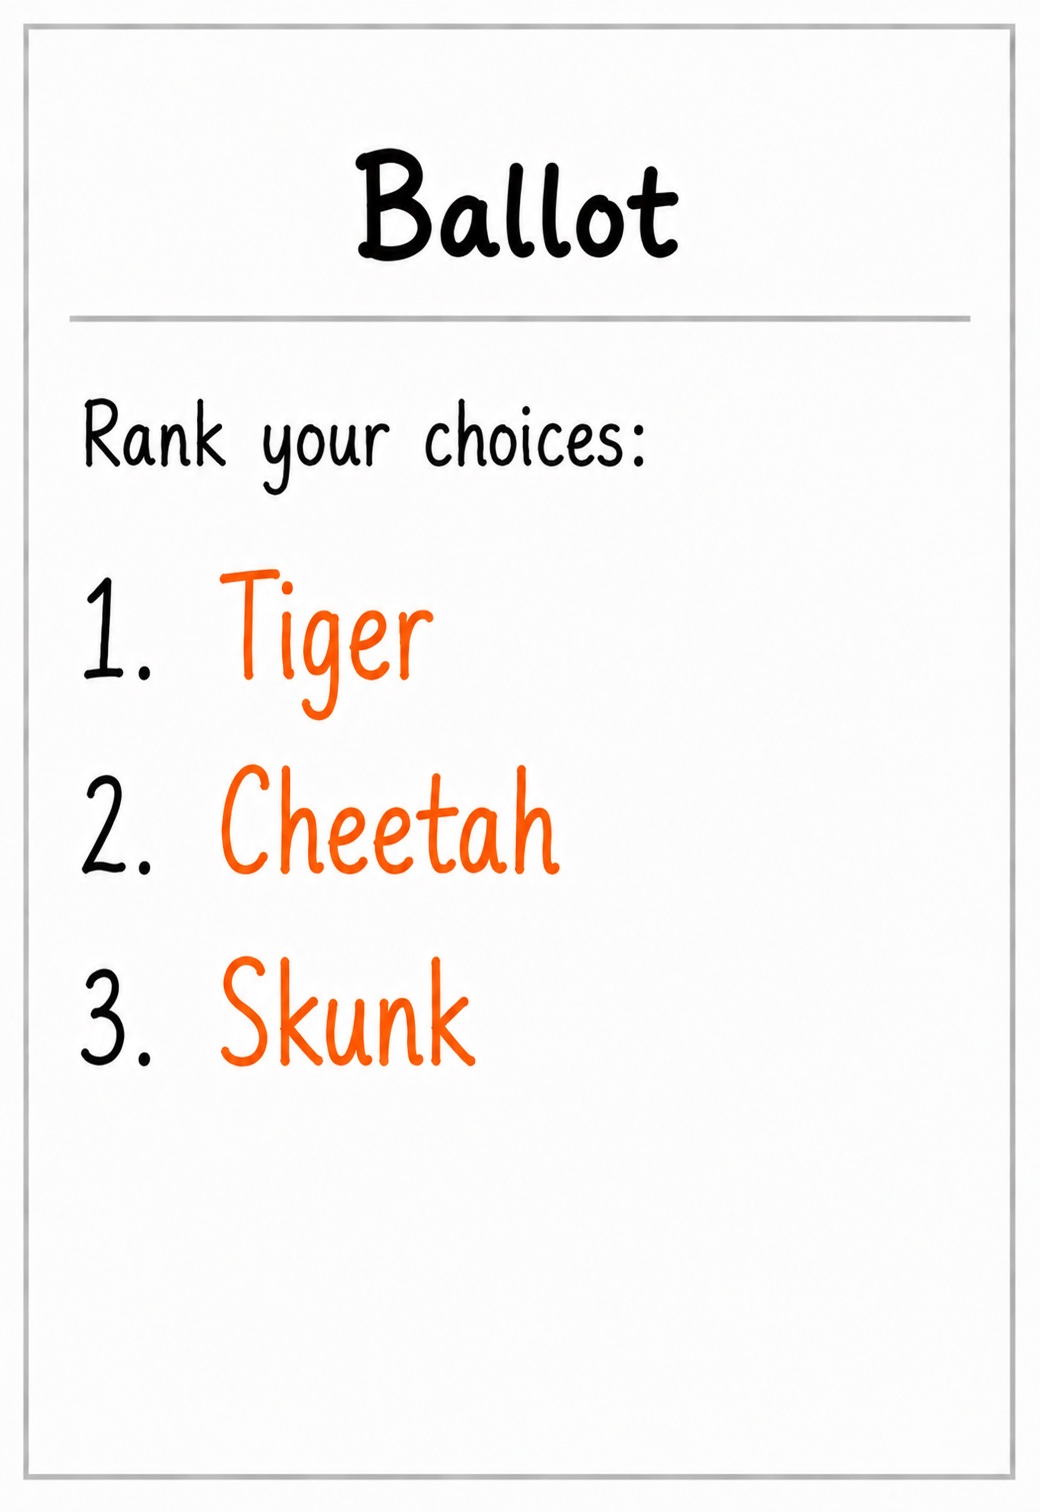
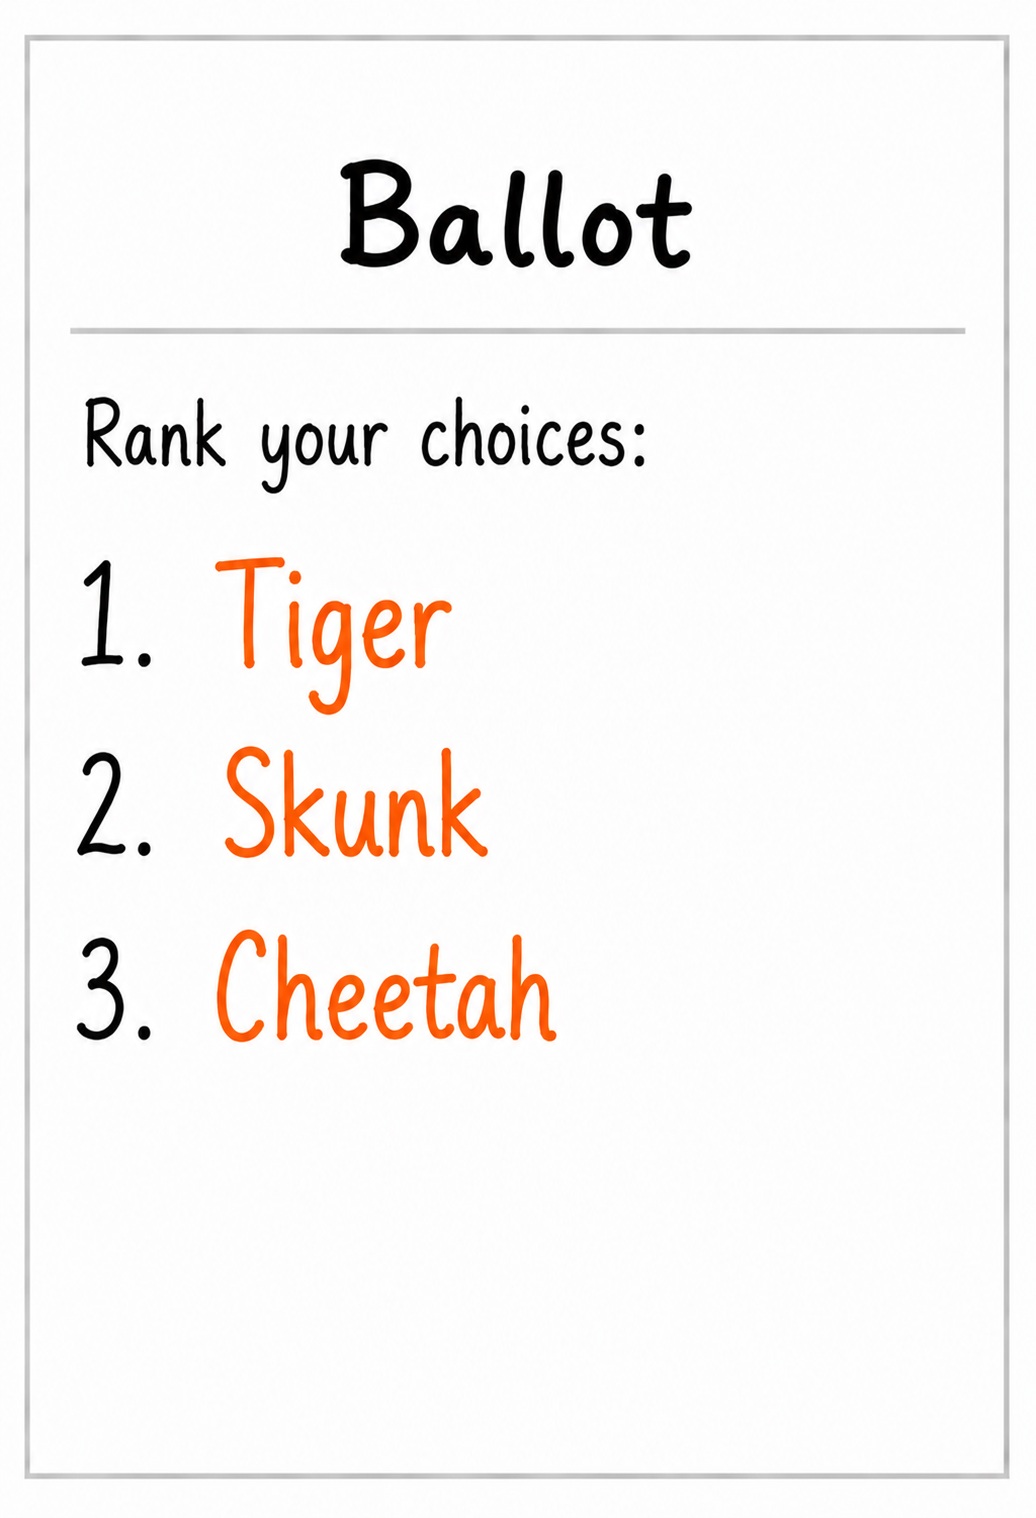
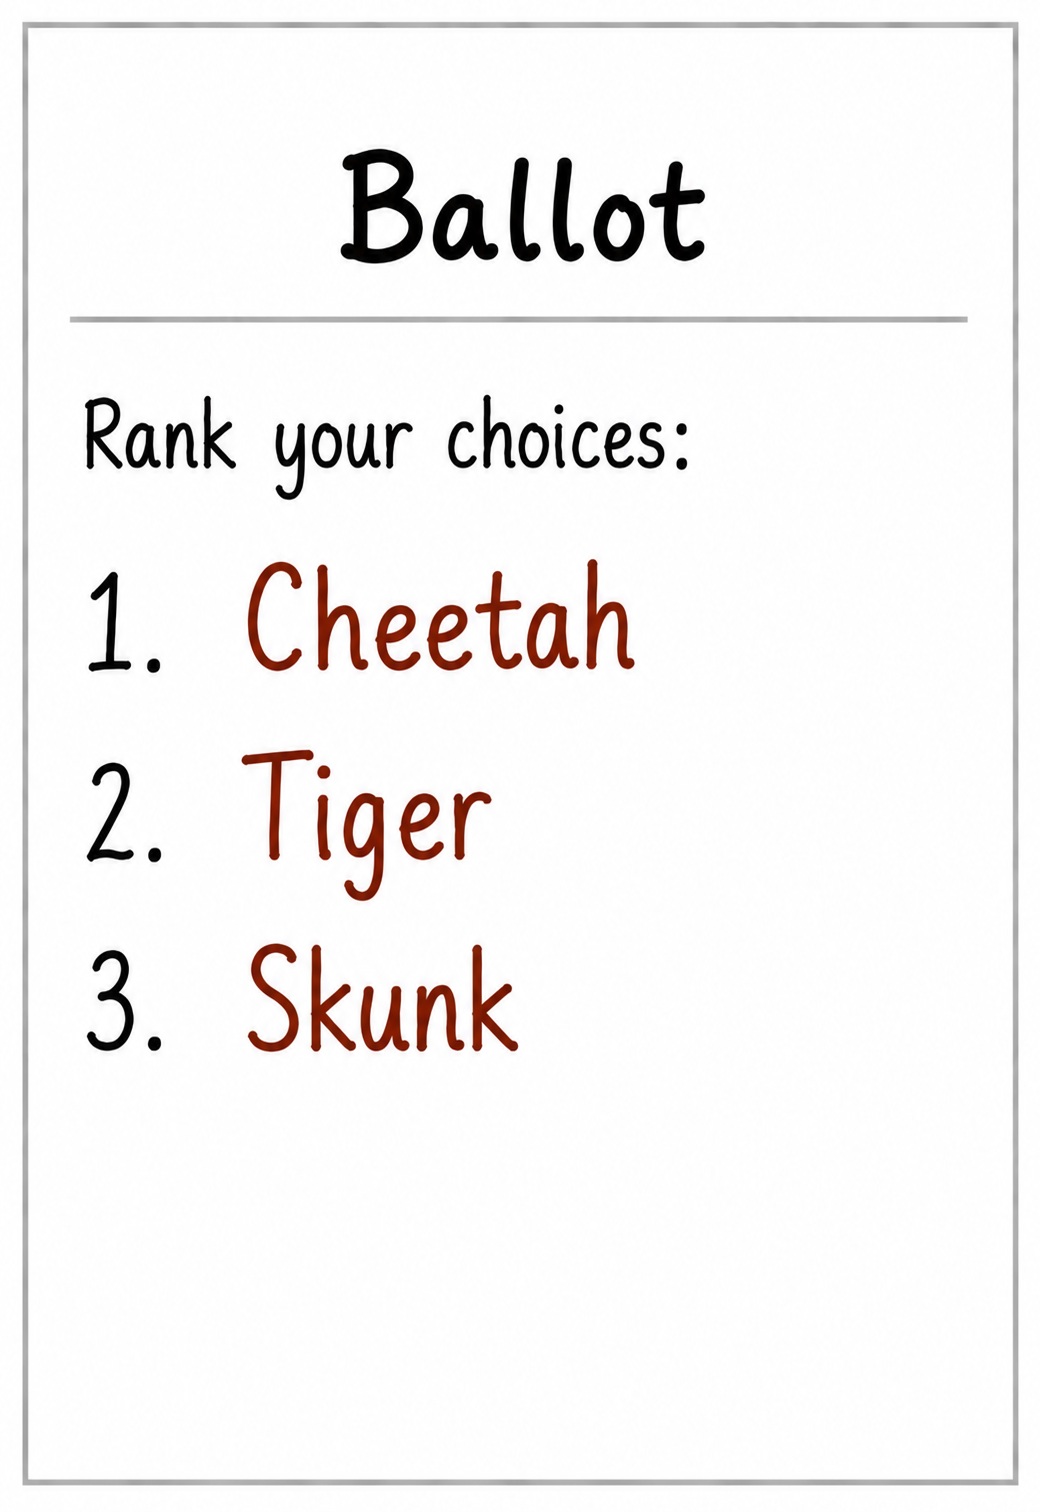
With Instant Runoff Voting, this becomes more difficult because the exact order of rankings on each ballot can affect the final result. A local region would need to report counts of every possible voter-filled ballot. In a 3-way race, if all voters submitted complete rankings (with no partial rankings), the number of combinations requiring counts would be:

More generally, if we let RIRV-CR represent the number of required reporting totals where all voters submitted complete rankings for N candidates, it can be calculated as:
For 5 candidates:
For 10 candidates:
However, in most Instant Runoff Voting elections, voters prefer to rank only their top choices and leave the remaining candidates blank. When this happens, the number of voter-filled ballot combinations becomes even larger. In a 3-way race, the combinations would be:


More generally, if we let RIRV-PR represent the number of required reporting totals where voters can submit partial rankings for N candidates, it can be calculated as:
For 5 candidates:
For 10 candidates:
The growth in possible ballot ranking categories quickly becomes very large:
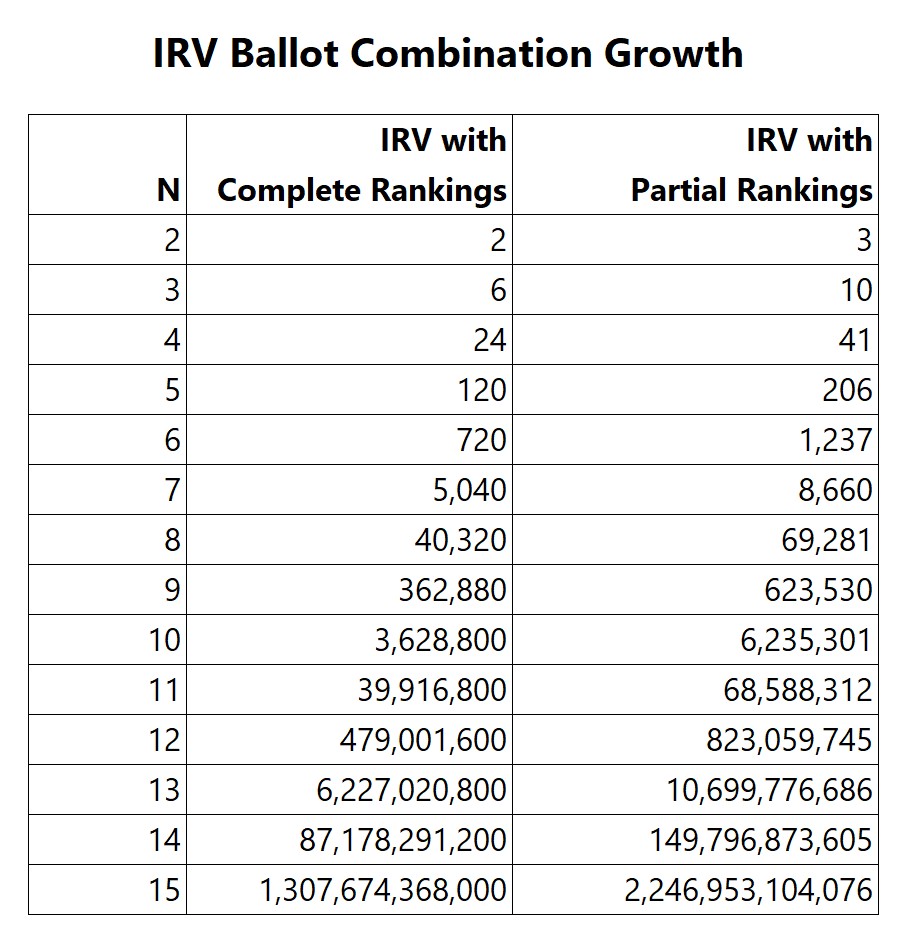
In some cases, the number of possible ballot ranking categories becomes larger than the realistic number of voters participating in the election itself. This does not mean local regions report millions or billions of separate ballot counts. In practice, many regions report only first-place vote totals, and then send all ballots to a central location for tabulation. This can delay results because when there is no majority winner, all ballot information needs to be gathered before IRV transfers can be fully processed. The additional steps, delays, and reduced transparency into local results have led to additional criticism of Instant Runoff Voting.
Head-to-Head Methods Reporting Requirements
Head-to-head methods such as Head-to-Head Record, Ranked Pairs, and Schulze operate differently. Instead of requiring counts of every possible combination of ballots to process results, they only require head-to-head totals between candidate pairs. For example, suppose Highland County held an election using ranked ballots and a head-to-head method. The Lakewood region might report results like this:
The only information regions would need to report would be the relative totals between candidate pairs. Ballots that do not show a preference between two candidates would still count toward the total ballot count, but would not count for either candidate in that matchup. The minimum counts the region would need to report could look like:
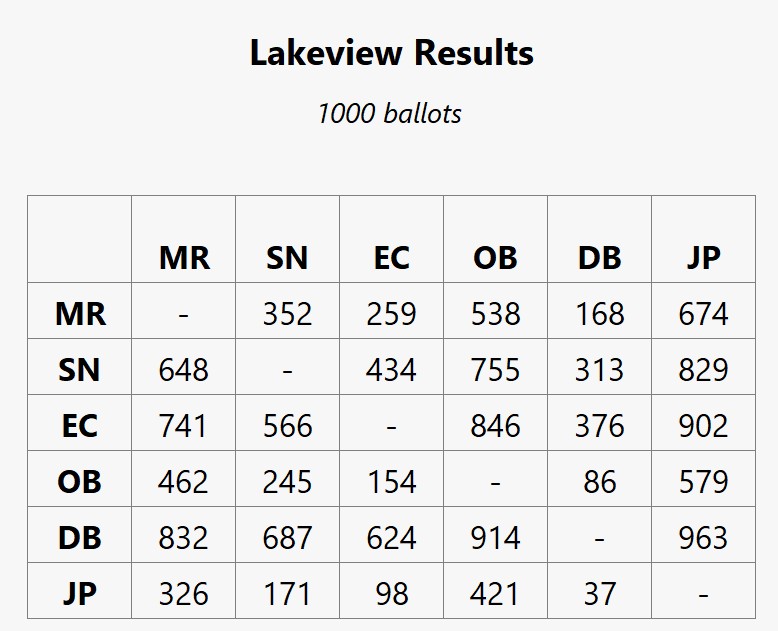
After all regions report results in that format, a complete county result could be generated by simply adding the values from each corresponding regional cell. The combined result could look like:
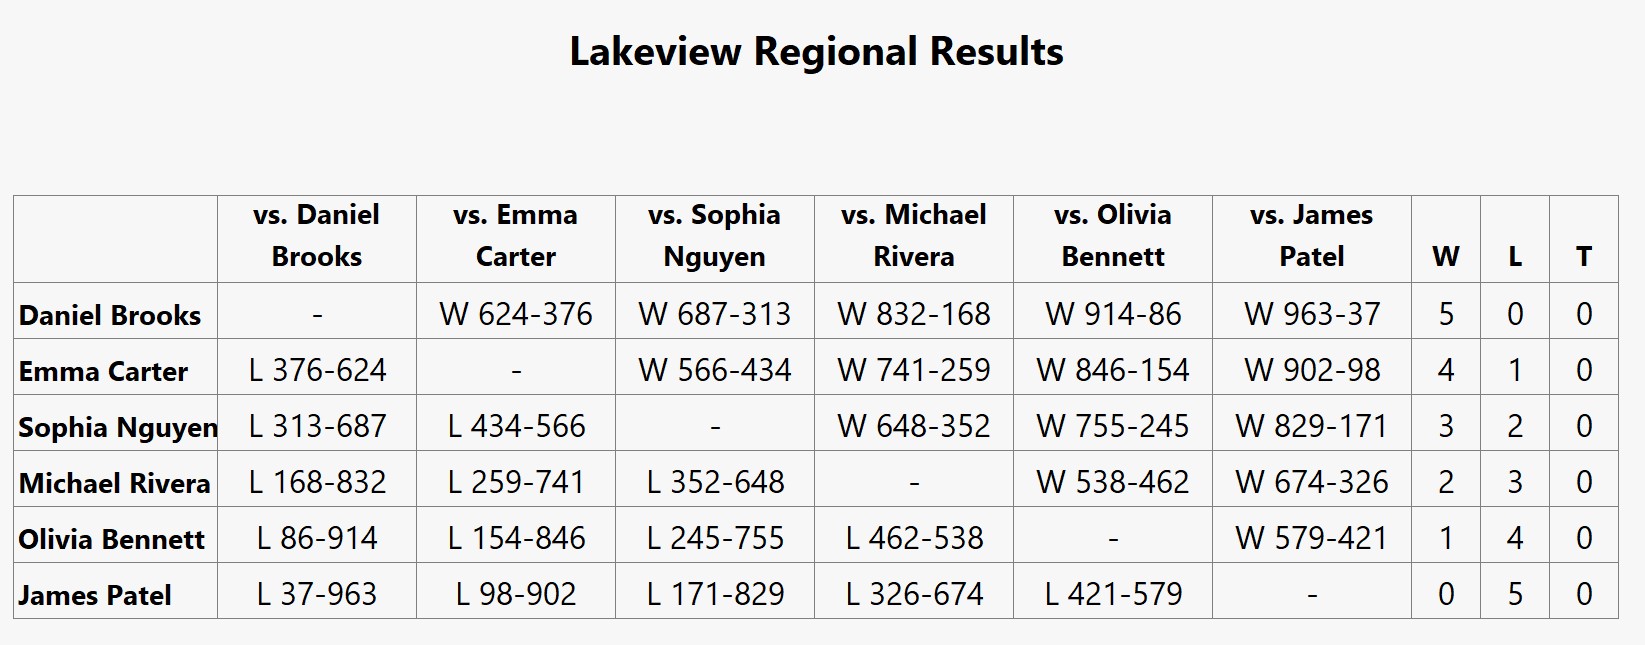
That combined result can then be used by head-to-head methods such as Head-to-Head Record, Ranked Pairs, or Schulze to determine a winner. For example, if Highland County used Head-to-Head Record, the final standings would look like:
More generally, if we let RH2H represent the number of required reporting totals for head-to-head methods with N candidates, it can be calculated as:
The additional +1 represents the total ballot count.
For 5 candidates:
For 10 candidates:
Even with 15 candidates:
Because head-to-head methods only require totals between candidate pairs, they require far fewer reported totals than Instant Runoff Voting methods, especially as the number of candidates grows. This also allows much more election information to remain visible to observers at the local and regional level.
Approval Voting Reporting Requirements
Approval Voting also has relatively small reporting requirements. If we let RAV represent the number of required reporting totals for Approval Voting with N candidates, it can be calculated as:
This is actually 1 fewer reporting total than required by single-choice voting. The reason is that when a voter selects multiple candidates, instead of the ballot being treated as an overvote and discarded in a single-choice election, those selections are added to the counts of each respective candidate.
The table below compares the regional reporting requirements for the methods discussed above:
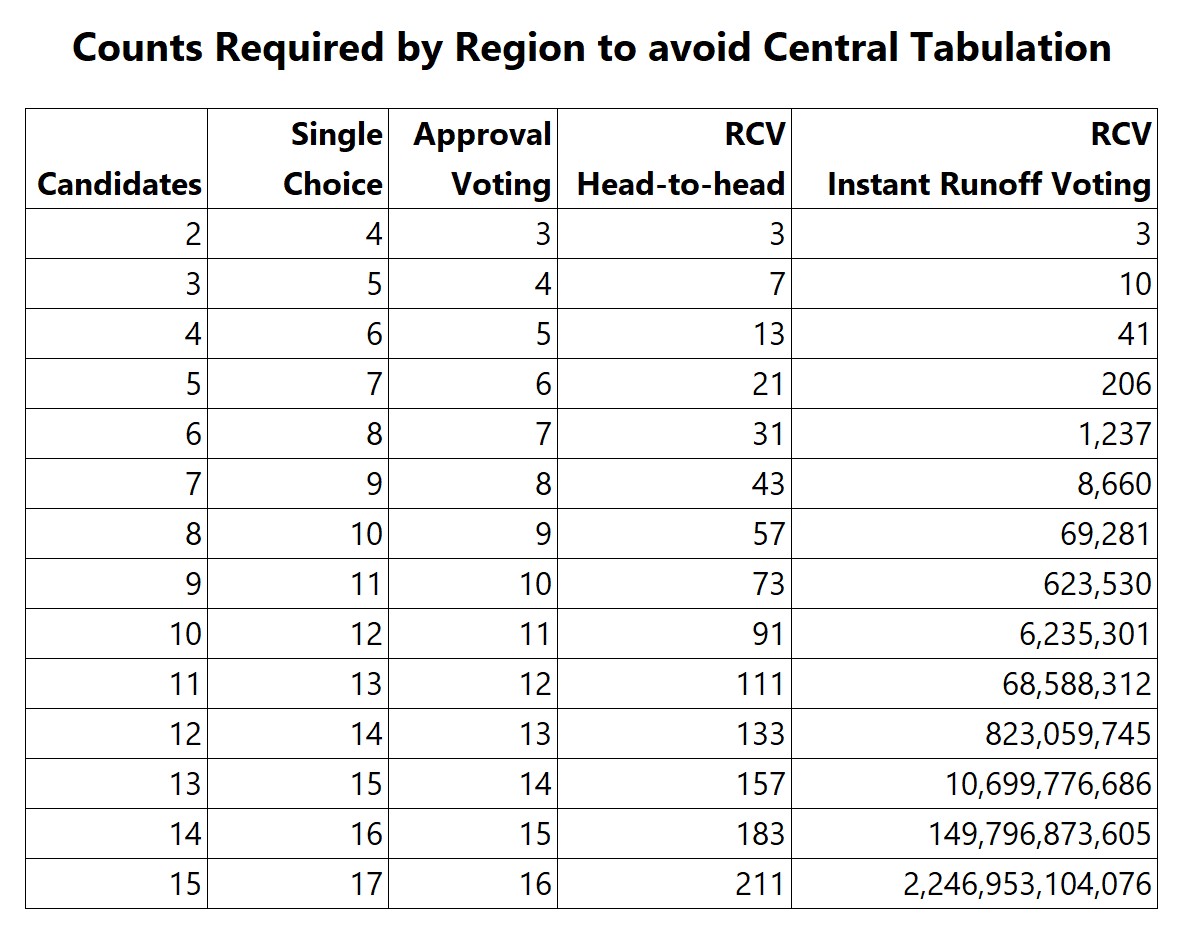
Different election systems create very different regional reporting requirements. Some systems can be summarized using relatively compact regional reports, while others require preserving far more detailed ballot information in order to reconstruct the final result exactly. These tradeoffs can affect not only the complexity of tabulation, but also how much election information remains visible at the local and regional level. As a result, different ranked voting systems may create very different balances between transparency, decentralization, reconstruction accuracy, and centralized tabulation requirements.
Comments
This site does not manage comment accounts. Comment data is handled by a third-party discussion service.